Debugging JNI native code with IntelliJ and CLion
Debugging problems occuring in native code used in Java via JNI can be is always very painful. Luckily, it's quite easily possible to use GDB and LLDB on Java processes, set breakpoints, and use the whole arsenal of tools that the debugger offers.
But wouldn't it be nice to use a graphical interface for GDB/LLDB, like the one that JetBrains' C/C++ IDE CLion offers?
Well, actually it is. Here's what to do:
- Have the project that generates the JNI library open and ready in CLion. Make sure the library is built with debug symbols.
- Create a test in IntelliJ (or your other favourite Java IDE), with a breakpoint before the code that you want to investigate.
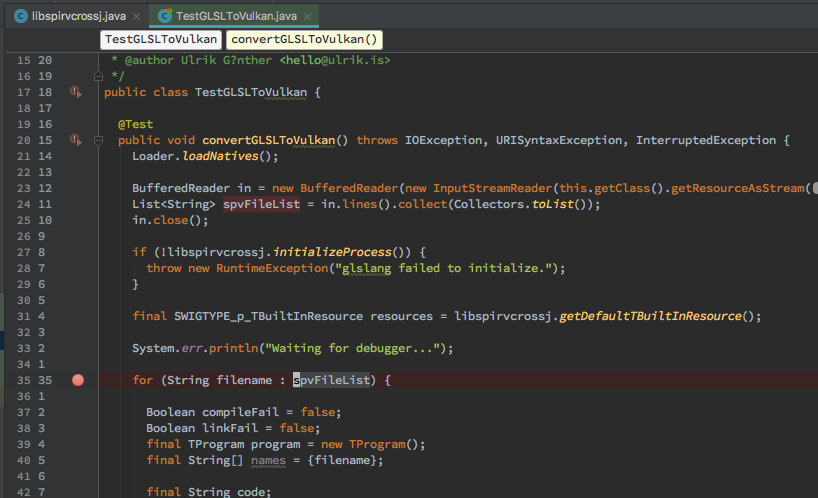
- Launch that test, and with
jpson the Terminal, figure out what process ID the test got. IntelliJ's test processes will show up there asJUnitStarter, depending on your exact test configuration: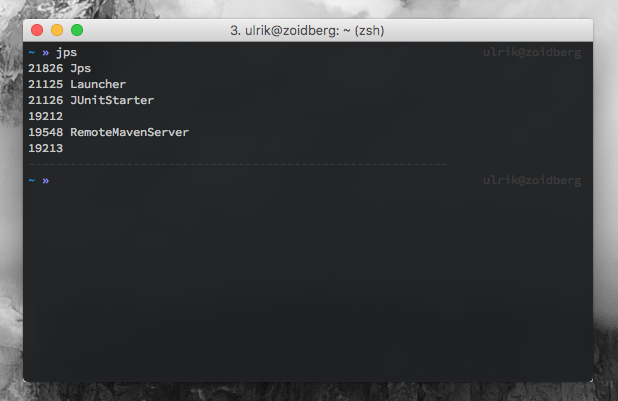
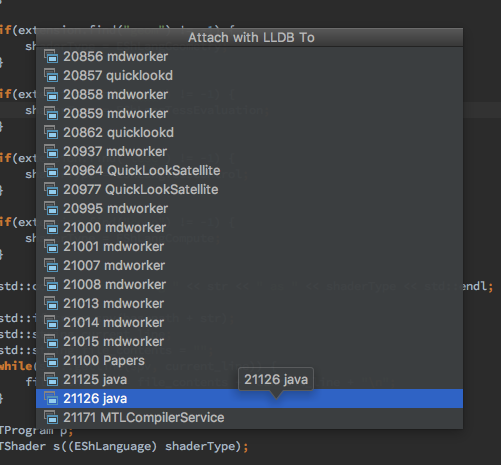
- in CLion, click Run > Attach to Local Process, and select the process corresponding to the process ID you figured out in step 3. The window also takes text input, which makes it easier to find the process:
- CLion will now attach to the process, and you can debug to your liking.
Note: I wrote this quite a while ago and unfortunately never got around to published it. As I think the approach is slightly unintuitive, and debugging JNI code can be quite hairy – here it is. Hope it's useful 👍